1995 Cape Verdean parliamentary election
|
|
All 72 seats in the National Assembly
37 seats needed for a majority |
|---|
| Registered | 207,648 |
|---|
| Turnout | 76.52% |
|---|
| | First party | Second party | Third party | | |  |  |  | | Leader | Carlos Veiga | Pedro Pires | Jorge Carlos Fonseca | | Party | MpD | PAICV | PCD | | Seats won | 50 | 21 | 1 | | Seat change |  6 6 | 2 | New | | Popular vote | 93,249 | 45,263 | 10,211 | | Percentage | 61.30% | 29.75% | 6.71% | |
 |
|
|
|---|
 |
|---|
|
|---|
| |
| |
Legislature - National Assembly
- President: Jorge Santos
|
| |
| |
| |
| |
|
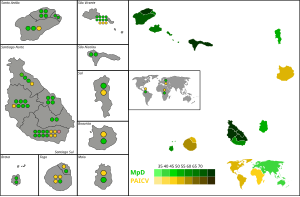
Parliamentary elections were held in Cape Verde on 17 December 1995. The number of seats was reduced from 79 to 72. The result was a victory for the ruling Movement for Democracy, which won 50 of the 72 seats.[1] Voter turnout was 76.52%.[2]
Results
 |
|---|
| Party | Votes | % | Seats | +/– |
|---|
| Movement for Democracy | 93,249 | 61.30 | 50 | –6 |
| African Party for the Independence of Cape Verde | 45,263 | 29.75 | 21 | –2 |
| Democratic Convergence Party | 10,211 | 6.71 | 1 | New |
| Democratic and Independent Cape Verdean Union | 2,369 | 1.56 | 0 | New |
| Social Democratic Party | 1,030 | 0.68 | 0 | New |
| Total | 152,122 | 100.00 | 72 | –7 |
|
| Valid votes | 152,122 | 95.73 | |
|---|
| Invalid/blank votes | 6,779 | 4.27 | |
|---|
| Total votes | 158,901 | 100.00 | |
|---|
| Registered voters/turnout | 207,648 | 76.52 | |
|---|
| Source: African Elections Database |
References
- ^ Elections in Cape Verde African Elections Database
- ^ Cape Verde: Parliamentary Chamber: Assembleia Nacional: Elections held in 1991 Inter-Parliamentary Union


 1995_Cape_Verdean_parliamentary_election